
Swissgrid builds its masts and lines to last 80 years. This unusually long service life stands in contrast to the rapid transformation of the energy sector as a whole, the speed of which is posing great challenges for all companies in the sector, including Swissgrid. Challenges have increased in particular in relation to the monitoring and control of the grid. Due to the energy transition and the increasingly short-term dynamics of the power markets, operators are constantly having to adjust to new situations in the grid.
One response to this more complex environment is data science, which enables vast quantities of data to be processed, patterns and connections to be identified, and thus reliable forecasts to be made. Data science is interdisciplinary, using methods from various areas such as mathematics, statistics, IT and, specifically, machine learning as a form of artificial intelligence.
Swissgrid has gained experience in the use of data science through a range of pilot projects. One of these is the «Probabilistic Nodal Load Forecast», which Tim Rohner and Koen van Walstijn created as part of their master’s and doctoral theses. This project has not only led to interesting results but – just as importantly – also enabled the company to gain a great deal of experience in the use of data science. In the interview below, Tim and Koen talk about their findings and the challenges they faced.

Tim and Koen, what was the question you set out to address?
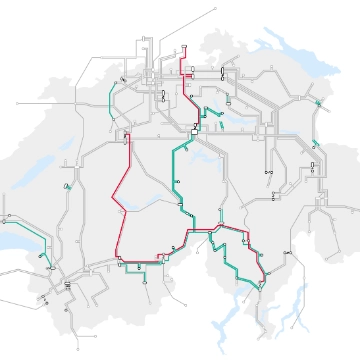
Tim: The aim of our work was to demonstrate precisely how high the feed-ins and feed-outs at specific nodes in the transmission grid might be at a particular time in the near future. What exactly does this entail? The grid has to be imagined as a graph made up of lines and nodes. The lines are power lines, while the nodes mainly represent substations. Electricity flows in or out at each of these 250 or so nodes in the Swiss grid. We wanted to forecast these energy flows (so-called netted demands) per node precisely, as these predictions form an important basis for grid security calculations. In our modelling, we had to take into account that the individual nodes cannot be considered independently of one another but in correlation. Gaining a coherent picture of all energy flows is incredibly complex. That’s where data science comes in.
Koen: In our research paper, we also wanted to quantify uncertainties. There are many uncertainties, in particular in relation to forecasting grid loads. How is consumption behaviour changing? How much energy will be produced, and when? We never know this for sure. We can now estimate how precise our forecast will be at what time and at which node. Data science is suitable when analysing a highly complex system that is influenced by randomness and unknown mechanisms.
Data science is suitable when analysing a highly complex system that is influenced by randomness and unknown mechanisms.
Koen van Walstijn
What methods did you use to resolve the issue?
Tim: Our solution is based on a method from the field of machine learning, specifically deep learning. A complex neural network discovers correlations on the basis of historical data. This might be consumption, production or even weather data. The system uses these correlations for the forecasting of the future energy flows per node.
Koen: The learning mechanism functions in such a way that the model generates completely random values right at the start. The results are constantly compared with the correct values, in other words values that have actually been measured in the past. By adapting the algorithm, we gradually achieved better results. It should be stressed that we don’t tell the algorithm explicitly what connections it should learn, but merely what target value. For that reason, the system is said to be «self-learning».
What challenges did you face during your project?
Koen: I was uncertain what the reactions to our work would be. Our models are intended to support Swissgrid in monitoring the grid. The methods used deliver a probabilistic forecast as for example: There is a 20% probability that this load is higher than 100MW. This is not easily integrated into the current operational processes. We also wondered how operators would react to our results, particularly if, for example, they didn’t correspond with their experiences. With this in mind, it’s important to explain the opportunities but also the limits of our forecasts precisely.
Tim: For me there were additional challenges: we selected a theoretical model that comes from research into machine learning. We then had to apply this model to real data. We didn’t know whether this would actually work well in practice. It also took a vast amount of time to procure the data.
Swissgrid has recognised this potential.
Tim Rohner
And did the model work in practice?
Koen: Yes. Through our work, we were able to demonstrate that our model can be applied in practice and succeeds in forecasting loads and their uncertainty. We are now trying to make the model even more precise, and for my doctoral thesis. I plan to use these forecasts to build a probabilistic model of the grid.
Tim: We are also preparing for the model to be used in daily work at Swissgrid. We are supporting an internal project aimed at improving the planning of grid operation. Our work has also shown that it is possible to realise a data science project in the company from the initial idea to implementation. With the IT infrastructure that Swissgrid is currently establishing, it is possible to carry out even larger data science projects. Data science is of particular interest to grid operators as they work in a complex environment where vast amounts of data are generated on a daily basis. Swissgrid has recognised this potential.
In a nutshell: The model for experts
The model is a so-called conditional variational autoencoder. This is a specific type of neural network and was introduced in 2013 and 2014 by Diederik P. Kingma and Max Welling. The variational autoencoder learns a representation of the nodal loads in latent space, including all correlations between the nodes. By sampling in latent space, different system states can ultimately be generated according to the joint distribution of loads.
Author