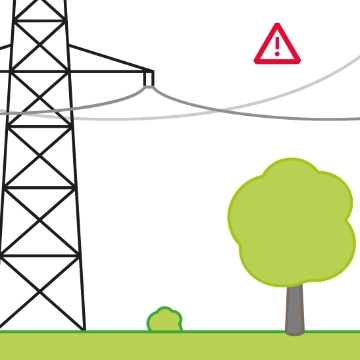
Since the opening of the electricity market at the beginning of 2009, Swissgrid has been receiving various energy data in its capacity as transmission system operator and balance group coordinator. It makes these available to the public.
The data is published continuously in the following charts and monthly in the «Energy Overview Switzerland». The data are reliable from 6 months onwards, until then the partners from the electricity sector who provide Swissgrid with the data can still claim changes.
Energy production
This chart shows the volume of electrical energy produced in Switzerland. It maps total production (green curve) and the volume of energy that is fed directly into the transmission system (grey curve). The resulting difference is the electricity fed directly into the distribution system. Switzerland’s current energy system is based on electricity production that usually takes place in large power plant blocks. This energy is initially transported within the transmission system, before being distributed through the various grid levels to consumers.
(Source: Distribution system operators)
Total energy consumption
This chart illustrates the development of overall energy consumption per month in Switzerland. This is the volume of energy consumed, including pumps in pumped storage plants, in-house consumption by power plants, and losses in the whole electric grid.
(Source: Distribution system operators)
End user consumption
This chart shows the volume of electrical energy used by end consumers in Switzerland each month. It does not include transmission losses, energy needed to run pumps, or energy consumed by the power plants themselves.
(Source: Distribution system operators)
Downloads
-
16 July 2026
Energy Statistic Switzerland 2026
XLSX -
19 May 2026
Energy Statistic Switzerland 2025
XLSX -
31 January 2025
Energy Statistic Switzerland 2024
XLSX -
16 July 2024
Energy Statistic Switzerland 2023
XLSX -
18 July 2023
Energy Statistic Switzerland 2022
XLSX -
18 July 2022
Energy Statistic Switzerland 2021
XLSX -
28 April 2021
Energy Statistic Switzerland 2020
XLSX -
24 February 2021
Energy Statistic Switzerland 2019
XLS -
6 September 2019
Energy Statistic Switzerland 2018
XLS -
17 April 2018
Energy Statistic Switzerland 2017
XLS -
31 December 2016
Energy Statistic Switzerland 2016
XLS -
31 December 2015
Energy Statistic Switzerland 2015
XLS -
31 December 2014
Energy Statistic Switzerland 2014
XLS -
31 December 2013
Energy Statistic Switzerland 2013
XLS -
31 December 2012
Energy Statistic Switzerland 2012
XLS -
31 December 2011
Energy Statistic Switzerland 2011
XLS -
31 December 2010
Energy Statistic Switzerland 2010
XLS -
31 December 2009
Energy Statistic Switzerland 2009
XLS