en

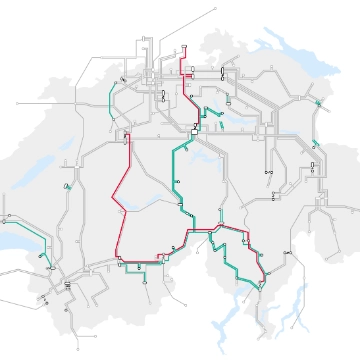
Current grid key figures

On this page, Swissgrid publishes monthly updates on the operation of the Swiss transmission grid: electricity imports and exports, the proportion of different generation technologies and the use of control energy to stabilise the grid.

Frequency

The graph shows the current frequency response. The setpoint frequency in the European interconnected grid is 50 hertz (Hz). Any deviation from this reflects an imbalance between electricity generation and consumption in the Continental Europe Synchronous Area. The green margin of tolerance indicates +/– 50 millihertz (mHz). If a deviation outside this margin persists for longer than 15 minutes, a European coordination process is initiated to bring the frequency back within the margin of tolerance by means of targeted energy activation. Swissgrid and Amprion coordinate this process for the Continental Europe Synchronous Area on a rotating monthly basis.

Missing data


Electricity exchange with other countries

The bars represent monthly electricity imports (negative values) and exports (positive values) between Switzerland and France (FR), Germany (DE), Austria (AT) and Italy (IT). The colours illustrate the contributions made by each country. The orange line shows the difference between imports and exports, indicating whether Switzerland was a net importer or exporter of electricity each month.

Missing data


Switzerland’s electricity mix and total consumption

The bars show monthly electricity generation in Switzerland, broken down by generation source: nuclear power plants, thermal power plants, run-of-river power stations, wind energy, photovoltaic plants and pumped storage power plants. The red line represents total electricity generation. In addition, the black line indicates the national consumption for the month in question.

Missing data


Use of control energy in Switzerland

The chart shows the monthly use of secondary control energy (SCE) and tertiary control energy (TCE) in Switzerland. The green and turquoise bars indicate the use of positive and negative secondary control energy respectively. The blue and purple bars indicate the use of positive and negative tertiary control energy respectively. Positive values indicate an increase in the amount of electricity fed into the grid or a load reduction, while negative values indicate a reduction in the amount of electricity fed into the grid or a load increase.

Missing data

Control energy is used to stabilise the grid when there are discrepancies between electricity generation and consumption. A distinction is made between various levels:

A distinction is made between positive and negative power for both secondary and tertiary control energy:


Import / Export

This chart shows the exchange of energy with neighbouring countries, Germany, Austria, Italy and France. The arrow points towards Switzerland when Switzerland is currently importing more active power from a neighbouring country than it is exporting. The arrow points towards the neighbouring country when Switzerland is currently exporting more active power than it is importing.

Contact

Title

Please select a title.

Please enter your first name.

Please enter your last name.

Please enter a valid e-mail address.

Please enter your message.

Please click the checkbox.